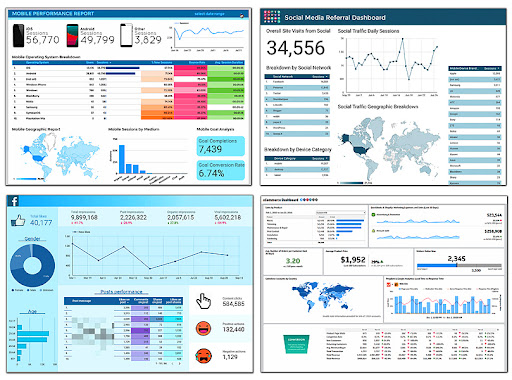
Business intelligence (BI) tools provide easy access to insights from different data sources. BI platforms make it easy to gather data about marketing and sales to business performance and productivity levels. They are crucial for modern businesses that can now track nearly every aspect of their operations.
Business intelligence allows data to be analyzed from multiple angles and connected with other isolated pieces of information. This is why it’s necessary to use the best business intelligence tools to improve business productivity through analytics.
What are business intelligence (BI) tools?
Business intelligence tools gather, process, and analyze large amounts of data from internal and external sources. Information can come from images, videos, books, social media posts, journals, emails, documents, etc. Data sources can include software programs, images, and charts. BI tools use queries to find and present information in various formats, such as reports, dashboards, and graphs.
With BI platforms, teams can access powerful tools: data and text mining, visualization, analytics, performance management, reporting, and predictive analytics. In addition, these tools allow employees to leverage information to make better decisions based on predictions, market trends, and KPIs. BI tools visualize past, current, and future information to provide business insights and reports. They also make it easy to make decisions thanks to features powered by self-service, automated reporting, and predictive analytics.
5 Best BI tools for analytics
Here are the top business intelligence tools for analytics currently available on the market.
Salesforce Tableau
After Salesforce acquired Tableau in 2019, it integrated it into one cohesive business intelligence tool with the best features from MuleSoft, Tableau, and Tableau CRM. Tableau allows users to create data visualizations with a variety of options easily. These include the ability to rearrange buttons in the interface and live visual analytics. Additionally, users can easily drag and drop different elements in the interface to spot trends quickly. Thanks to its versatility, the software connects to many databases and can connect to Google Analytics, Box, Microsoft Excel, and other data sources.

Pros of Tableau
Intuitive and functional data visualization
Active community & forums
Simple language creates relationships in data
Cons of Tableau
Expensive to access useful features
No automated reports
Weak data analytics for different data sources
Pricing of Tableau
$12-70 user/month
Microsoft Power BI
Microsoft’s Power BI is one of the most well-known business intelligence software tools. It is a downloadable software that runs analytics on a server or in the cloud. This tool syncs with sources like Facebook, Oracle, and more to generate reports and dashboards in minutes. It comes with built-in artificial intelligence capabilities, Excel integration, and data connectors. Additionally, it offers end-to-end data encryption, real-time data access monitoring, and an AI dashboard.

Pros of Microsoft Power BI
Integrated into the Microsoft digital ecosystem
Cheaper price point
Great data analysis tools
Strong collaborative setup
Cons of Microsoft Power BI
Cloud-heavy program
Steep learning curve
Bulky user interface
Pricing of Microsoft Power BI
$14-28 user/month
Redash
Redash is an exceptional open-source analytics program that works well as a supplemental tool accessible through a permissioned database. It’s best suited to work with teams utilizing some technical programming knowledge. Anyone with a background in MySQL can use Redash thanks to many online resources that can help guide them through learning the software. Redash receives a lot of support from its online community that helps to answer questions, move the project forward, and improve Redash.

Pros of Redash
Easy to install in the cloud and on any server
Large dashboards with multiple metrics across multiple streams
Simple to use and includes various visualization features
Remix and edit other people’s queries to gain new insights
Cons of Redash
Unclear if dashboards refreshed or not
Refreshing queries takes a long of time
Requires technical understanding to use the platform
Needs a lot of database permissions, and access control is not too fine-grained
Pricing of Redash
free when you host for yourself
Google Data Studio
Google Data Studio, or GDS, is a free data visualization tool marketed as a Business Intelligence tool. However, many experts believe it needs improvement to be on par with standard Business Intelligence tools such as Tableau or Power BI. Google Data Studio makes data easier to work with by making it more accessible and easy to collaborate. It allows teams to turn raw data into strategic information by using simple tools. GDS uses advanced data visualization methods to help businesses understand metrics and indicators that help them make better decisions. Data is easily acquired from Google tools like Search Console, AdWords, Analytics, and YouTube.

Pros of Google Data Studio
Great customization and branding options
Fine-tuned report sharing
Made for the cloud
Comments & notes feature
Cons of Google Data Studio
Not a quintessential BI tool, which better suited for reporting
Restricted usage of data from third-party sources
Steep learning curve
No real-time data updates
Limited data processing methods
Pricing
Free to use except for data storage and processing
QlikSense
QlikSense’s toolset is easy to use thanks to its user-friendly design and advanced artificial intelligence features. It also makes use of high-performance cloud platforms and self-service tools. QlikSense’s associative exploration feature, Search & Conversational Analytics, helps data analysts easily ask questions and find answers. This helps increase data literacy among new users of BI software.

Pros of QlikSense
Solid capabilities for setting up repeatable reports, managing data access, and scaling to large workloads
Immediate response to changes, updates, and interactions
Supports a wide variety of file types and data sources
Robust machine learning (ML) toolkit
Cons of QlikSense
Inflexible data extraction capabilities
Limited visualization due to lack of some basic charts
Complicated token pricing model
Data solution is sluggish when working with large data sets
Pricing: $30 user/month
Conclusion
Data gathering techniques are constantly improving thanks to the increased data surrounding us. By choosing the right tools for business analytics and big data, you can achieve a more stable, cohesive, aggressive, and predictable management of your data.
We’ve reviewed the best tools on the market so you can find the perfect fit for your department or company. We hope our review inspires you to explore business intelligence tools and helps you find your ideal setup.
At Itirra, we provide companies with customized solutions and opportunities to explore potential improvements to support their business goals. For a personalized recommendation based on your unique business model, don’t hesitate to get in touch or schedule a meeting with me.
