

An increasing number of executives understand how Business Intelligence (BI), data discovery, and advanced analytics can help to make better business decisions and give a competitive advantage in a continuously evolving world.
We have already touched on the topic of data-driven business by describing how well-interpreted data can impact your decision-making process. You can learn how to optimize your company’s strategy to move your business forward in our previous post: How Can Data Help You Evolve Your New Business?
Today, our experts want to go a step further and help you figure out where your organization stands and how it can get better with the business intelligence maturity model.
What is the BI Maturity Model?
Developed by Transforming Data with Intelligence (TDWI), a leading data research company, the business intelligence maturity model helps organizations to better align information technology with their business efforts.
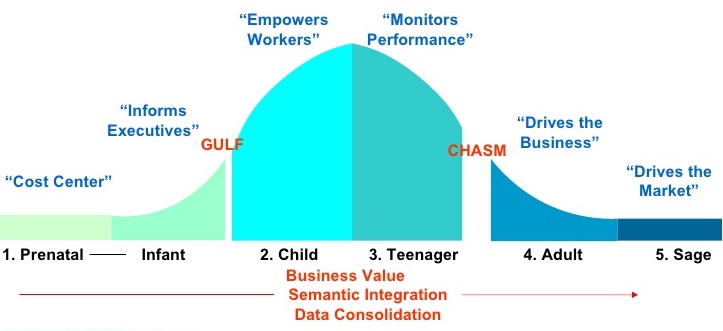
Source: TDWI website
A 6-stage model illustrates the path a business should follow to evolve its strategy from localized paper reports and spreadsheets to a universal, fully-automated reporting system.
The key focus of the model is the assessment of an organization’s technical aspects: scope, sponsorship, funding, value, architecture, data, development, and delivery. The results of the evaluation assign an organization into the Prenatal, Infant, Child, Teenager, Adult, or Sage stage.
Stages of the BI Maturity
1. Prenatal
Data structure: Management reports
Scope: System
Executive perception: Cost center
At this stage, a data-centric system such as ERP or CRM regularly produces reports that are then printed out or emailed to a group of employees.
To get the custom report, an IT specialist has to create it manually. It increases reliance on an individual developer and makes the knowledge transfer difficult.
2. Infant
Data structure: Spreadmarts
Scope: Individual
Executive perception: Inform executives
Custom reports have limited capabilities and take too long to produce. To save time, business analysts or power users often bypass an organization’s IT experts by extracting data from ERP or CRM and loading it into so-called ‘spreadmarts’ (spreadsheets and desktop databases).
Spreadmarts are more time-efficient and easy to produce. It makes them difficult to discard and results in companies failing to provide accurate and consistent reports.
As your company moves from one stage to the next, you should expect to face a series of challenges and obstacles. But make sure you are prepared to deal with two major barriers, the Gulf and the Chasm.
The Gulf will arise during the shift from the Infant to the Child stage. Most likely, the problem will be caused by poor planning, poor data quality, and the use of spreadmarts.
The best solution for having an efficient and accurate exchange of information is to manage and store data in a standardized, consistent manner.
3. Child
Data structure: Data Marts
Scope: Department
Executive perception: Empower knowledge workers
At this stage, due to the increasing data volume, programs like Excel become inefficient. Systems and processes are slowing down and are no longer cost-efficient. The need for a shared database, a data mart, becomes a necessity.
Each department has its definitions and rules. What’s more, they extract data directly from CRM and ERP systems. It works for supporting local needs, but the problem arises when data from different departments have to be grouped for a broader analysis.
4. Teenager
Data structure: Data warehouses (DW)
Scope: Division
Executive perception: Monitor business processes
The best way to regulate data marts is to create a centralized data warehouse by standardizing definitions and rules across departments.
It will provide a deeper level of analysis and will help to gain insights that were not possible with one-department data mart.
Early stages of business intelligence only deliver business value to a certain extent. To fully obtain all benefits, an organization has to cross the second major barrier between the Teenager and Adult stages, the Chasm.
The solution is to connect all data warehouses to build an enterprise data warehouse. To meet the requirements of the fast-changing business environment, your company must merge data from all business units and promptly deliver new applications and reports to all employees.
5. Adult
Data structure: Enterprise data warehouse
Scope: Enterprise
Executive perception: Drive the business
Internal growth, much like mergers and acquisitions, can result in multiple differing data warehouses that restrict the information flow between business units.
The best solution is to merge all data warehouses into a unified system: an enterprise data warehouse.
6. Sage
Data structure: BI services
Scope: Inter-enterprise
Executive perception: Drive the market
In the final stage of the maturity model, business intelligence becomes a system that drives core business processes and gives a competitive advantage.
As you begin your business intelligence maturity journey, you should be prepared for a very slow rise in business value during the first three stages of BI maturity. However, as soon as your company will overcome the obstacles faced and move to the Teenager stage, your business will become a BI enterprise that drives mission-critical processes, delivers rich insights, and gets a higher chance of generating significant business value.
ITIRRA’s experts are happy to assess your business’ BI maturity stage according to the TDWI business maturity model and help you take your company to the next level. To find out more about how BI can transform from an insight delivery to business monitoring and finally to an automated decision-making system or discuss how our solutions can help you generate significant business value, contact us today or arrange a meeting with Michael.